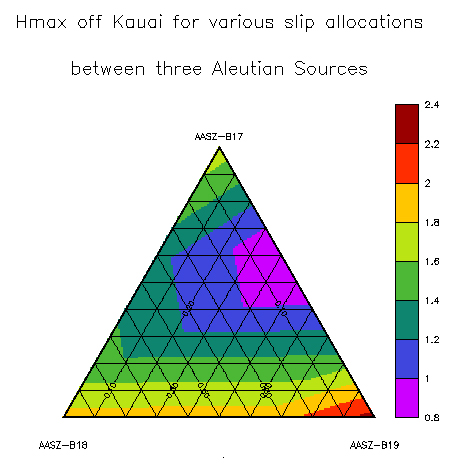
The following is a triangular plot the is illustrating tsunami waves. The plot above has three variables which each define horizontal and vertical axes. By using the plot above and studying the three variables, you can determine which wave trains will cause the greatest wave at which impact site.
No comments:
Post a Comment